What home price does the usual US lending rule allow on your salary?
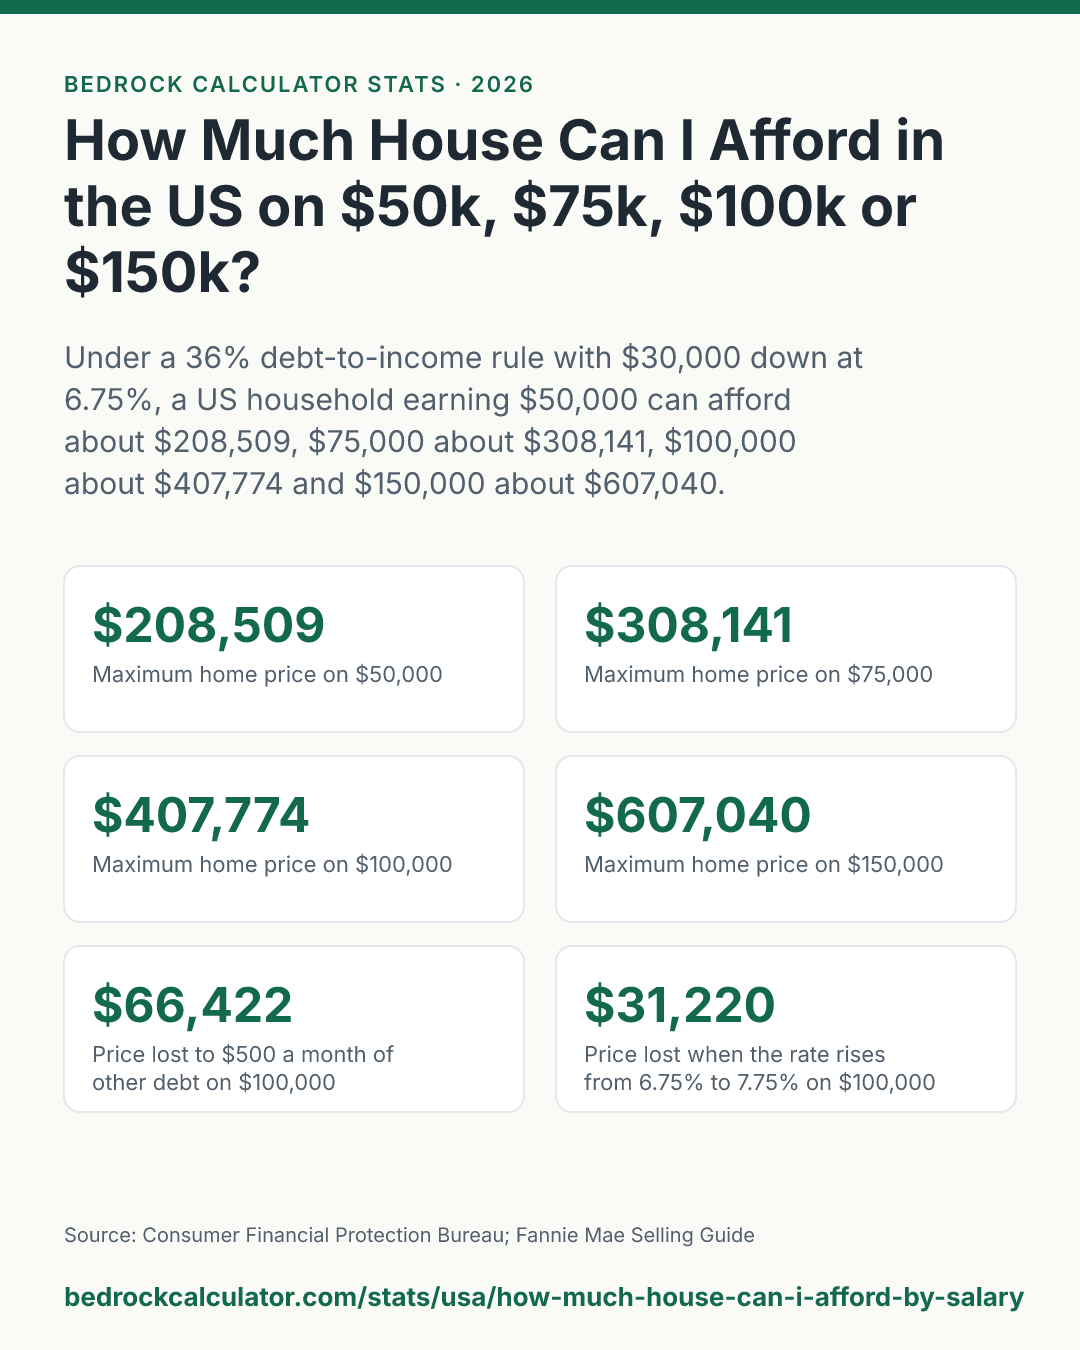
Using the common US lending rule that your total monthly debt, including the new house payment, shouldn't go over 36% of your gross pay, here's roughly how much house each salary buys with $30,000 down at a 6.75% mortgage rate and no other debt:
- $50,000 a year: about $208,509
- $75,000 a year: about $308,141
- $100,000 a year: about $407,774
- $150,000 a year: about $607,040
Other debt is the fastest way to shrink those numbers. A $500 monthly car payment knocks $66,422 off what a $100,000 earner can buy.
The rule behind the numbers
Lenders don't look at what a house costs and ask if it feels affordable. They look at your debt-to-income ratio: every monthly debt payment you'd have after buying, divided by your gross monthly income.
The site's house affordability calculator uses a 36% back-end limit. On $100,000 a year that's $3,000 a month for everything: principal, interest, property tax, homeowners insurance and any car, student loan or card payments you already have. With no other debt, the whole $3,000 can go to the house.
The calculator then works backwards. It finds the home price where the 30-year loan payment, plus property tax on that price, plus insurance, adds up exactly to the budget. Property tax goes up with the price, so the calculator solves for it rather than assuming a fixed share.
How we worked out these numbers
We ran the house affordability calculator once for each salary with these inputs:
- $30,000 cash down payment, all of it going toward the price
- A 30-year fixed mortgage at 6.75%
- Property tax of 1.25% of the home's price per year
- Homeowners insurance of $1,500 a year
- No other monthly debt, unless the table says otherwise
The rate, tax rate and insurance amount are the calculator's defaults. They're a reasonable middle, not a national average and not today's quoted rate. Your state's property tax could be half that or double it, which is why there's a separate page on how much house $100,000 buys in each state.
How much house can you afford on each salary?
How much house you can afford by salary in the US (36% debt-to-income rule)
Download CSVNo other monthly debt, $30,000 down, 30-year fixed loan at 6.75%, 1.25% property tax, $1,500 a year insurance. PMI, HOA dues and closing costs not included.
| $50,000 | $208,509 | $178,509 | $1,500 | $1,158 | $217 | 4.2 |
| $75,000 | $308,141 | $278,141 | $2,250 | $1,804 | $321 | 4.1 |
| $100,000 | $407,774 | $377,774 | $3,000 | $2,450 | $425 | 4.1 |
| $150,000 | $607,040 | $577,040 | $4,500 | $3,743 | $632 | 4 |
The price stays close to the same multiple of salary all the way up. On $50,000 the maximum price is 4.2 times income; on $150,000 it's 4 times. Two fixed dollar amounts pull in opposite directions on a small budget: the $30,000 down payment is a bigger boost, and the $1,500 insurance bill is a bigger drag.
On $50,000 a year, the monthly budget is $1,500. Of that, $1,158 goes to principal and interest, $217 to property tax, and the rest to insurance. That buys about $208,509.
On $75,000 the budget is $2,250 and the price is about $308,141. On $100,000 it's $3,000 and about $407,774. On $150,000 it's $4,500 and about $607,040.
How much house can you afford with a car payment?
Maximum home price with other debt or a different mortgage rate
Download CSV$30,000 down, 1.25% property tax, $1,500 a year insurance. Debt columns use a 6.75% rate; rate columns assume no other debt.
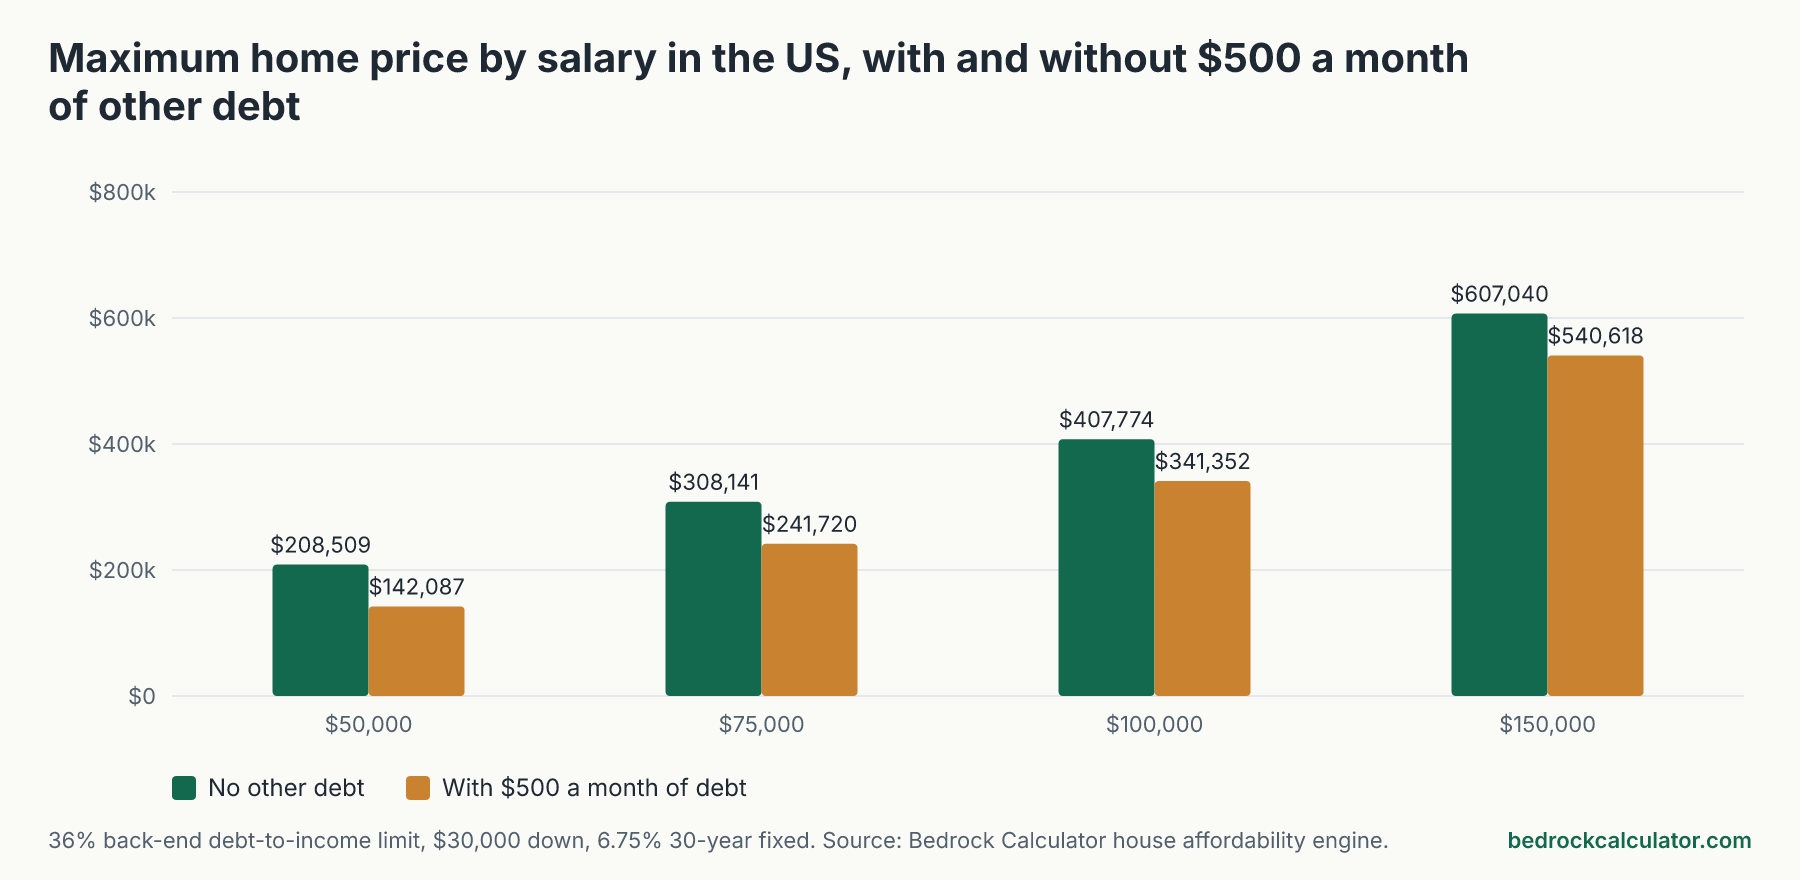
| $50,000 | $208,509 | $142,087 | $75,665 | $225,386 | $193,756 |
| $75,000 | $308,141 | $241,720 | $175,298 | $334,439 | $285,155 |
| $100,000 | $407,774 | $341,352 | $274,930 | $443,492 | $376,554 |
| $150,000 | $607,040 | $540,618 | $474,196 | $661,598 | $559,352 |
Every dollar of existing debt comes straight out of the housing budget, so it hits hardest at lower incomes. A $500 monthly payment cuts the price a $50,000 earner can afford from $208,509 to $142,087, a drop of 31.9%. At $150,000 the same payment cuts 10.9%.
With $1,000 a month of other debt, a $50,000 household can only afford $75,665, and a $100,000 household $274,930. Paying off a car loan before you apply can do more for your buying power than another year of saving for the down payment.
What a higher mortgage rate costs you
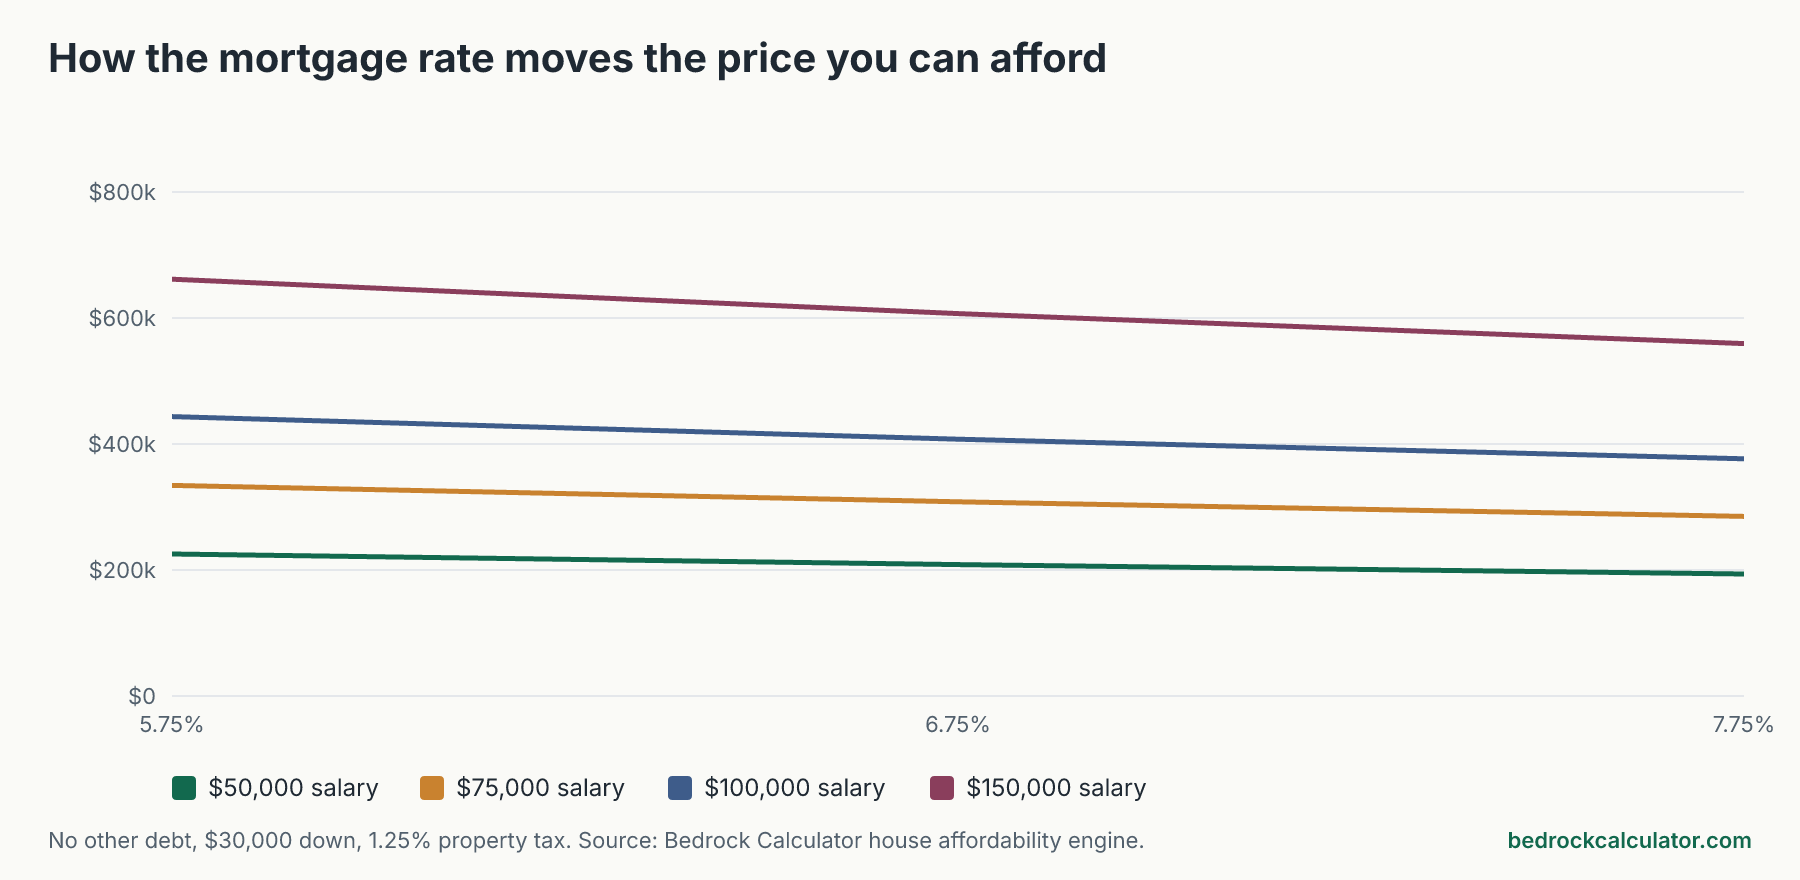
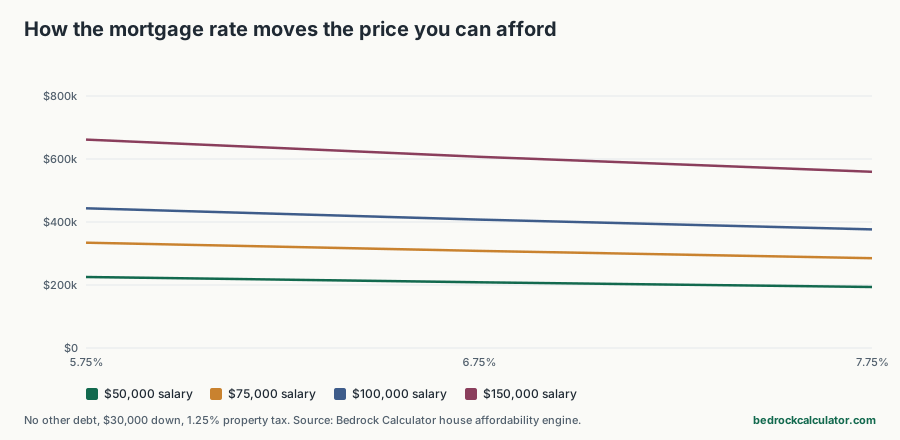
Rates move buying power a lot. On $100,000 a year, going from 6.75% to 7.75% lowers the price you can afford from $407,774 to $376,554, a loss of $31,220. Dropping to 5.75% lifts it to $443,492.
The monthly budget doesn't change in any of these cases. What changes is how much of it goes to interest instead of buying house.
What this leaves out
The calculator answers one question, the maximum price under one rule, and it leaves out some real costs:
- PMI. With $30,000 down, you'd be putting 14.4% down on the home a $50,000 salary buys and 4.9% on the one a $150,000 salary buys. Below a fifth of the price, most conventional loans add private mortgage insurance, which isn't modeled. It would lower every price on this page. See what PMI costs at each down payment.
- A separate housing-only limit. Many lenders also cap housing costs alone at a lower share of income than total debt. The calculator only checks the 36% total, so with no other debt these prices sit at the high end of what a lender might approve.
- HOA dues. Condos and many newer neighborhoods charge monthly fees that lenders count as debt. They aren't included.
- Closing costs and reserves. The calculator puts the whole $30,000 toward the price. In practice some of your cash goes to closing costs, and lenders may want a few months of payments left in the bank.
- Loan programs. FHA and VA loans can allow higher debt ratios, and some lenders are stricter. Your credit score also changes the rate you get.
The calculator also says nothing about whether the payment fits your life. A lender-approved budget uses gross pay, before taxes, retirement saving and childcare. Plenty of people choose to spend well under the maximum.
Run your own numbers
Open the house affordability calculator and put in your income, existing monthly debt, down payment, and your local rate and property tax. Then check the monthly payment on the price you're considering with the mortgage calculator, and see where your current ratio stands with the debt-to-income ratio calculator. If the down payment is the hard part, the down payment savings calculator shows how long it takes to get there.